How to Use Technical Analysis for Forex Trading

Technical analysis plays a vital role in Forex Trading, offering traders a structured approach to understanding price movements and market trends. By using historical data and chart patterns, traders can make informed decisions and manage risks effectively. Here, we break down the essential steps to use technical analysis in forex trading.
Understand the Basics of Technical Analysis
Technical analysis focuses on historical price data and volume rather than external factors like political events or macroeconomic indicators. Its core principle is that price movements already reflect all relevant information. Traders analyze trends, support and resistance levels, and repeating chart patterns to predict future movements.
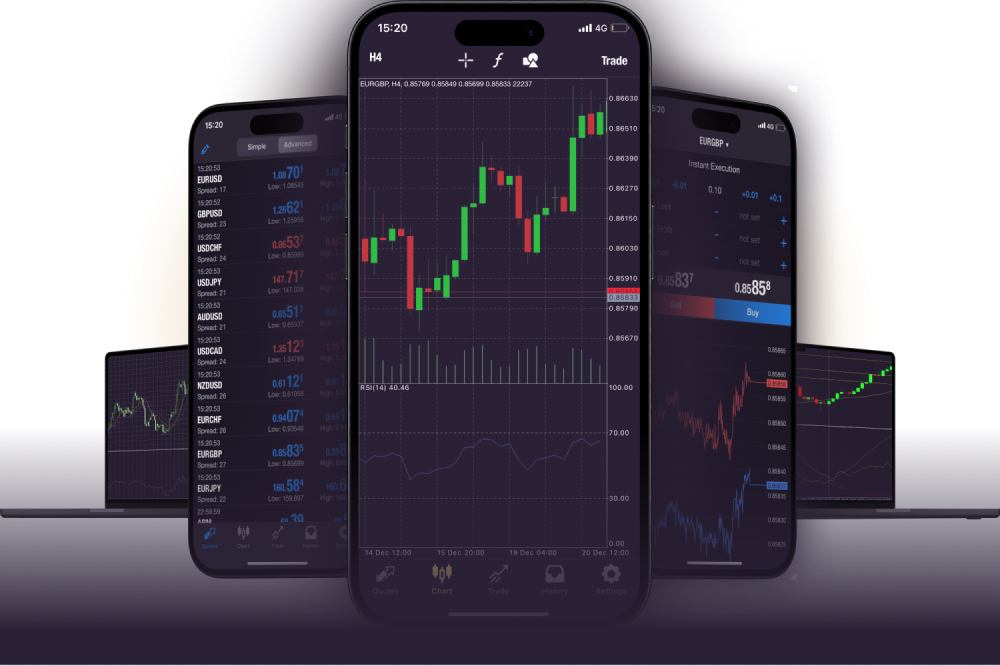
The widely used tools include candlestick charts, which show price movements over time, and indicators such as moving averages, RSI (Relative Strength Index), and MACD (Moving Average Convergence Divergence). Familiarizing yourself with these tools is a good starting point.
Identify Trends and Patterns
Spotting trends is one of the key functions of technical analysis. Forex markets often exhibit upward (bullish), downward (bearish), or sideways (neutral) trends. Identifying these trends involves analyzing past data to predict future movement.
For instance:
•Trendlines visually depict the market’s general direction by connecting significant price points.
•Support and resistance levels indicate price points where the market may reverse or stall, offering signals for potential entry and exit points.
Recognizing chart patterns like head-and-shoulders, triangles, or double tops/bottoms can give additional clues about potential market shifts.
Utilize Technical Indicators
Technical indicators provide valuable insights when used alongside price action analysis. These fall under different categories, such as momentum indicators, trend-following indicators, or volatility-based tools.
•RSI (Relative Strength Index): Gauges whether a currency pair is overbought or oversold.
•Bollinger Bands: Help traders identify volatility and potential reversal zones.
•MACD (Moving Average Convergence Divergence): Highlights momentum shifts by analyzing convergence or divergence between two moving averages.
Combining multiple indicators often produces stronger signals, but traders should avoid overloading charts with too many tools, which can lead to conflicting analyses.
Develop a Trading Plan
While technical analysis is powerful, it isn’t foolproof. Integrate it into a robust trading plan. Define your goals, set a risk-to-reward ratio, and determine stop-loss and take-profit levels. Always backtest your strategy using historical data before deploying it in live markets.
Final Thoughts
Technical analysis empowers forex traders to make calculated decisions based on price action and trends. By mastering chart analysis, patterns, and indicators, you can improve your trade execution and identify opportunities in dynamic markets. Continue refining your skills and stay updated with the latest analytical tools for long-term success.
